A System That Predicts the Future Behavior of Stocks & ETFS

Pick Up on Wall Street Signals You Can't See on a Chart

Chaikin Analytics

The Culmination of a 50 Year Career on Wall Street

If you aren't familiar, the Power Gauge rating system is the culmination of Marc Chaikin's 50 year career on Wall Street... where he worked with some of the most prestigious hedge funds in history, run by the likes of Steve Cohen, Michael Steinhardt, Paul Tudor Jones, and George Soros.

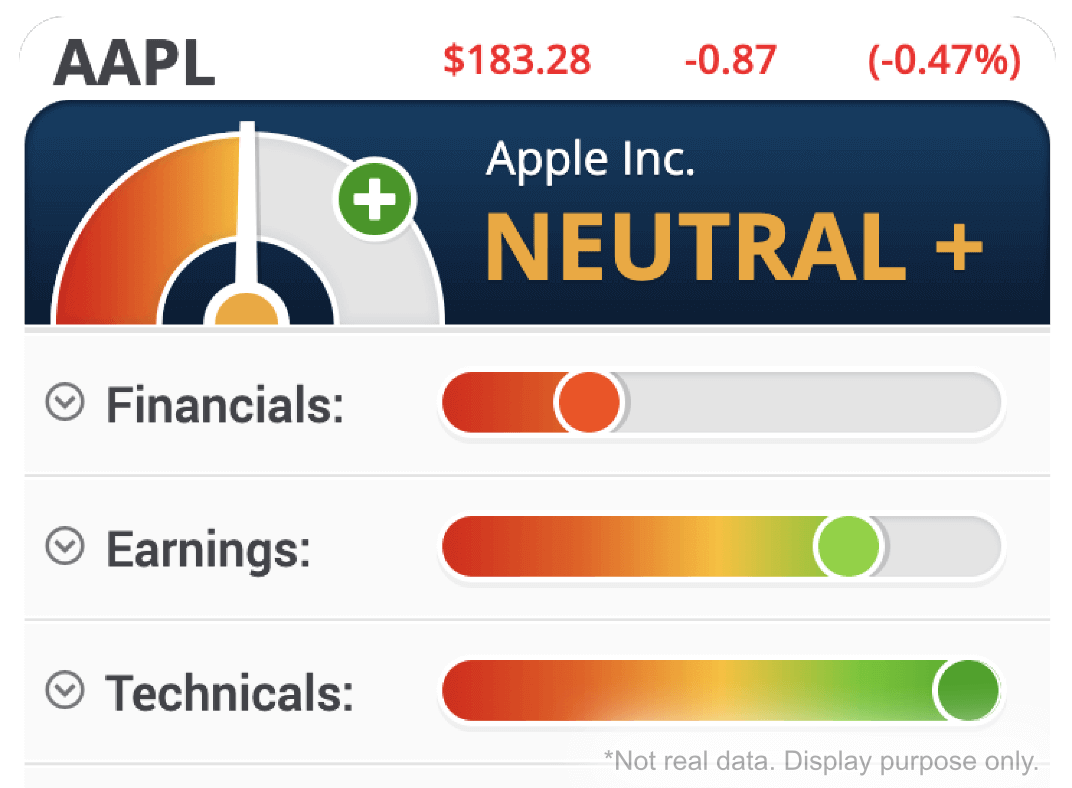
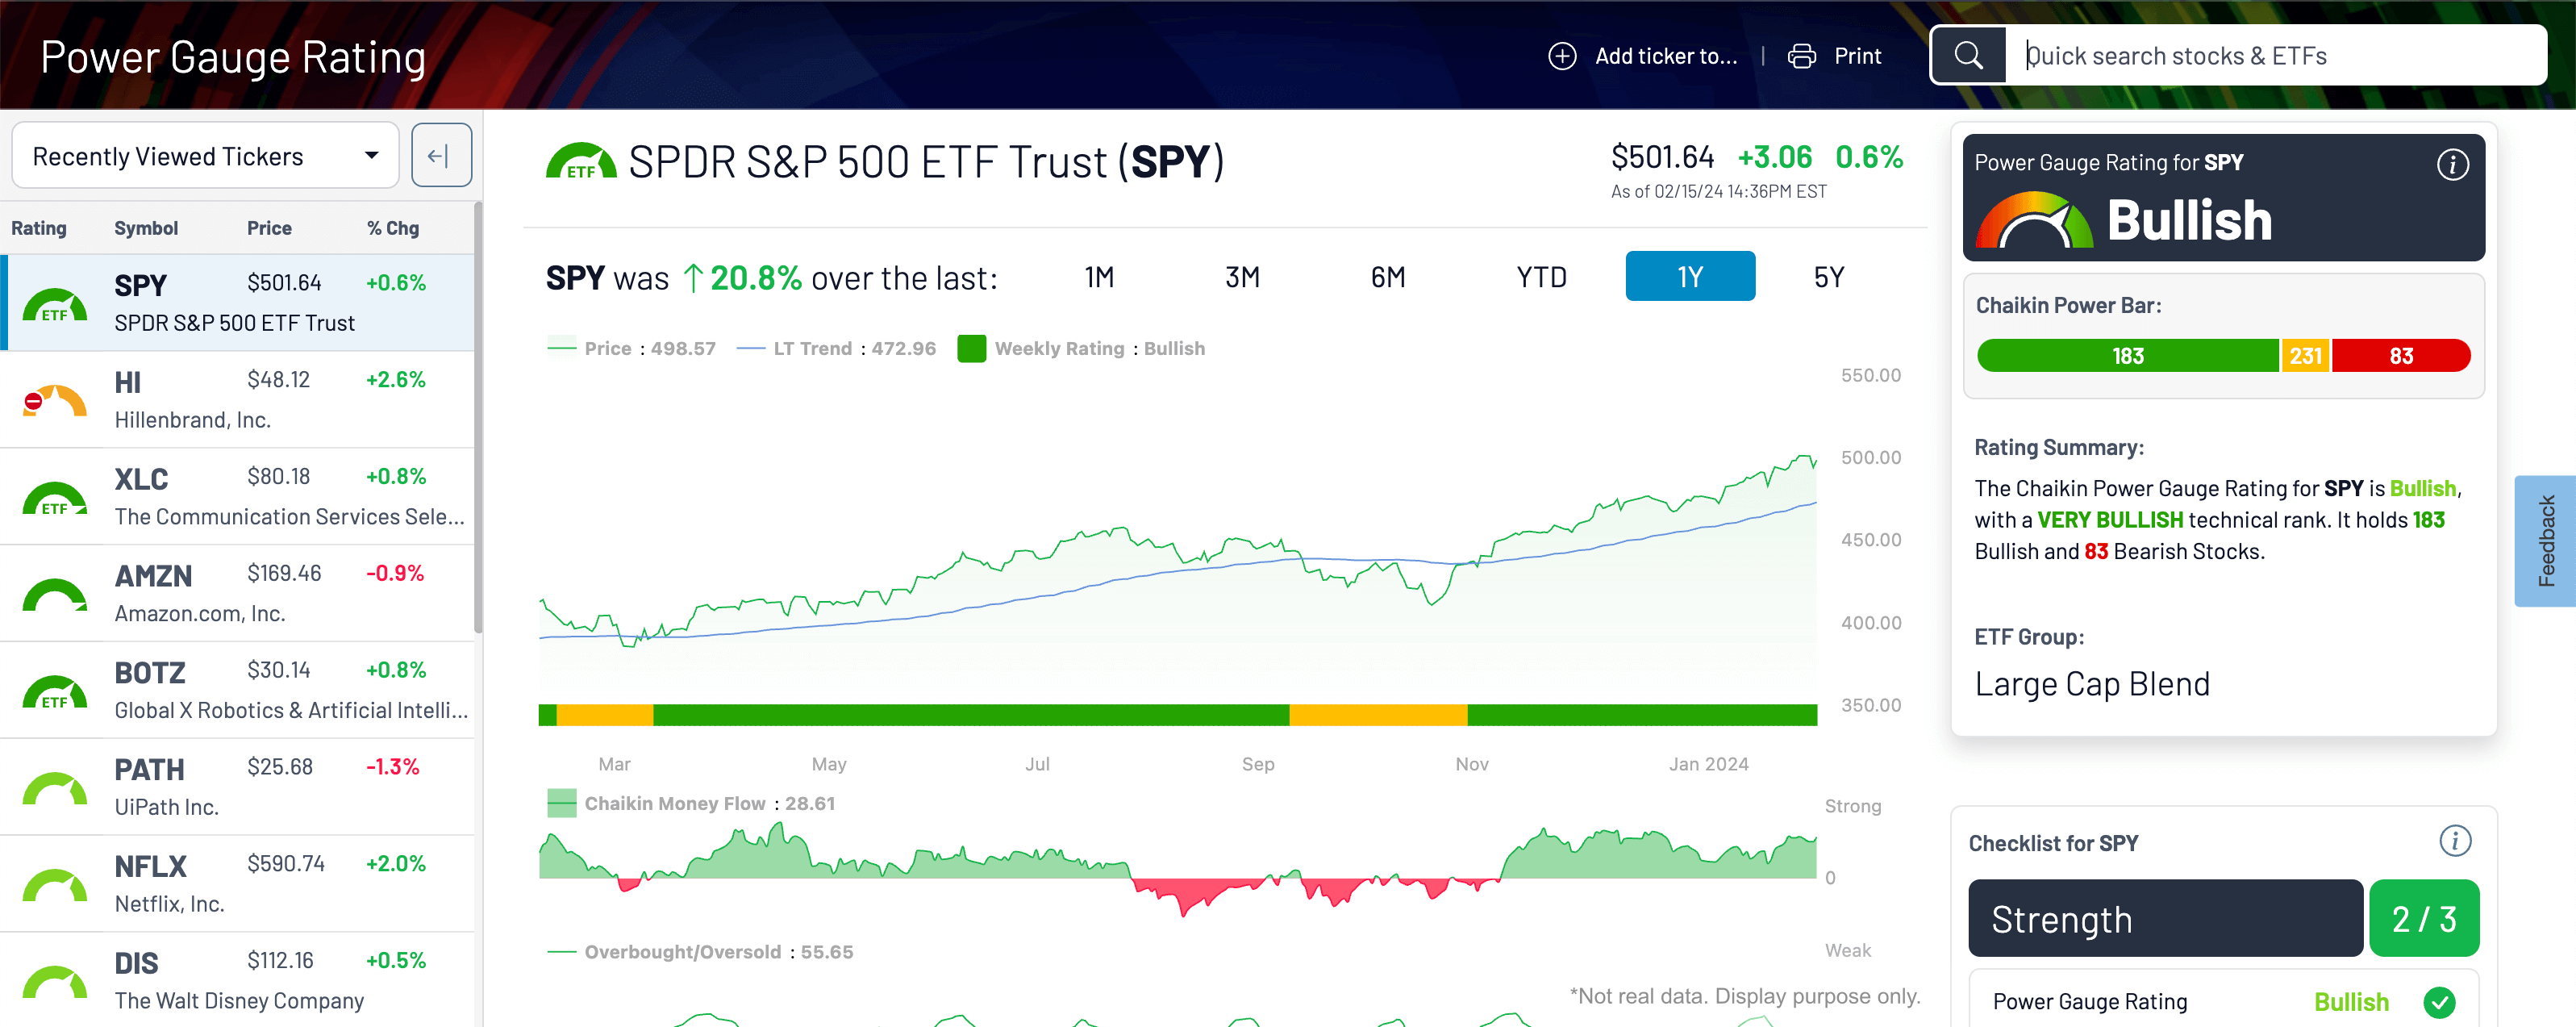
He built the system to scan the market each trading day, and issue a Bullish, Neutral, or Bearish rating on over 5,000 stocks and 2,300 ETFs.

It's a one-of-a-kind system that predicts the future behavior of stocks and ETFs - based on the same stock-rating system Marc helped design for professional investors, traders, and analysts over decades. The system is supported by over ten years of independent backtesting and successful real-world performance since 2011.

The Chaikin Power Gauge rating is the centerpiece of everything we do - It picks up on signals you could never see simply looking at technical charts.

The rating ranges from Very Bearish (likely to underperform) to Very Bullish (likely to outperform).

The stock rating combines twenty of the most important factors that can impact price movement... and distills them down into a simple, reliable prediction of future performance.

The ETF rating combines the proprietary stock rating model with technical analysis factors to predict an ETFs potential.

Chaikin Analytics

Decades of Knowledge Packed Into A Powerful System

During Marc Chaikin's career, it was evident to him that Wall Street had a clear advantage over individuals. They had all the information at their fingertips... Teams of analysts at their every beck and call... and the best and brightest to spearhead their research. They had the complete story for each and every company and individuals simply did not... That all changed with the Power Gauge. It accounts for a company's fundamentals AND technicals... Here are the 20 factors of the power gauge rating explained in detail:

Financials

  • Free Cash Flow

    A stock's net free cash flow relative to its Market Cap for the latest quarter.

  • Long-Term Debt to Equity

    Total long-term debt divided by total common equity, for the latest quarter.

  • Return on Equity

    Income available to common shareholders as a percentage of average common equity for the past five years.

  • Price to Sales

    The ratio of a stock's Market Cap plus long-term debt divided by sales, over the past 12 months.

  • Price to Book

    The ratio of a stock's current price divided by its book value per share, as of the latest quarter.

Earnings

  • Earnings Growth

    The weighted average of the last 3 to 5 years growth in earnings per share.

  • Earnings Trend

    The EPS percentage change over the trailing 12 months.

  • Earnings Surprises

    The weighted average of recent quarterly EPS surprises.

  • Projected P/E

    The ratio of a stock's current price divided by its earnings per share, as of the latest quarter.

  • Earnings Consistency

    The consistency of EPS over recent and projected fiscal years.

Technicals

  • Chaikin Money Flow

    Chaikin Money Flow is a technical indicator that calculates the buying pressure or selling pressure for a stock.

  • Price Trend ROC

    The 42-day change in divergence from the stocks 200-day exponential average (DEMA).

  • Volume Trend

    The ratio of a stock's 30-day versus its 90-day average volume.

  • Price Strength

    The ratio of a stock's closing price to its 200-day exponential average (DEMA).

  • Relative Strength vs. Market

    A stock's six-month price performance versus the S&P500.

Experts

  • Industry Relative Strength

    The six-month performance of a stocks industry versus the market.

  • Insider Activity

    The net shares of a stock purchased by company insiders over the past six months.

  • Short Interest

    Percentage of a stock's outstanding shares that investors have sold short but not yet covered or closed out.

  • Estimate Trend

    13-week change, mean analyst EPS estimate for the next fiscal year.

  • Analyst Rating Trend

    The four-week change in a stock's average analyst rating.

Access an Award-Winning System Built by the Best

You don't win the award for 'Best Industry Research Provider' without providing reliable research tools that beat the competition... Each feature in the Chaikin system is built around Marc's proven approach.

Power Gauge Rating

The Chaikin Power Gauge rating is the centerpiece of everything we do - It picks up on signals you could never see simply looking at technical charts. The rating ranges from Very Bearish (likely to underperform) to Very Bullish (likely to outperform). The stock rating combines twenty of the most important factors that can impact price movement... and distills them down into a simple, reliable prediction of future performance.

Power Gauge Rating

MoneyFlow Indicator

Marc Chaikin built his career as a technical expert... dedicated to timing the ebbs and flows of the market and finding ideal entry and exit points. That's why one of his most famous technical indicators is Chaikin Money Flow... which can be found on almost every charting platform around the world. Money Flow allows you to visualize what the 'smart money' is doing... which is why Marc included it as one of the 20 factors in the Power Gauge rating.

MoneyFlow Indicator

Chaikin Hotlists

Generate Ideas with One Click of the Mouse. Chaikin Idea and Hotlists, the Power Gauge does all the heavy lifting for you... With one click of the mouse, you'll generate a list of stocks with favorable ratings or setups. Hotlists include: All Bullish Stocks, Very Bullish Stocks, Oversold Buys, and more!

Chaikin Hotlists

Chaikin Discovery Engine

On Netflix, after you watch a specific movie, Netflix will automatically recommend something similar to you... That's how the Discovery Engine works. Type in a ticker, and you'll see stocks that have similar characteristics, ranks, or technical setups. The Discovery Engine is also a great way to find potential swap ideas. If a stock is rated BEARISH, and is likely to implode... simply add it to the Discovery Engine and you'll see a list of potential swap ideas.

Chaikin Discovery Engine

Put the Power of Wall Street in Your Hands

Join thousands of professionals and everyday folks who receive actionable insights from the Chaikin team. Anticipate upcoming market movements, get stock ideas daily, earnings updates, trends, and more! Delivered to your inbox Monday through Friday - 100% FREE.

By entering your email, you are signing up to receive Chalkin Powerfeed as well as occasional marketing messages. You can unsubscribe from each at any time. Our privacy policy.

Chaikin Analytics