You've probably been hearing the term "October effect" in the financial media recently...
This refers to the belief that bad things tend to happen to the markets in October.
The 1907 bank panic, the 1929 market crash that kicked off the Great Depression, and the "Black Monday" single-day crash in 1987 all happened during the month of October.
As such, many investors tend to get worried around this time of year.
Meanwhile, we've already seen plenty of volatility so far in 2025. And as you know, we're in the midst of a government shutdown.
So it's no surprise that many folks might be feeling particularly nervous right now about a looming market disaster.
So today, let's take a look at what the October performance in recent years tells us we might expect ahead...
We'll start with this chart. It shows the S&P 500 Index's performance during October since 2000.
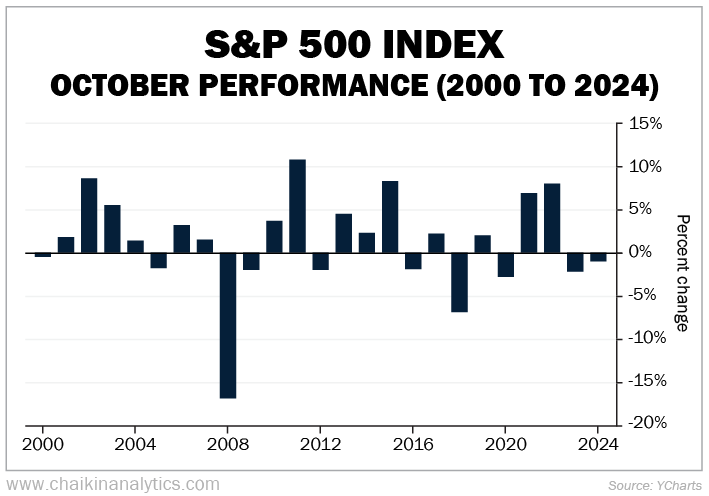
As you can see, October has generally been good for the stock market over this time frame. The S&P 500 gained in 15 instances. And it fell in 10 instances.
And if we remove the largest gain and loss (the outliers) from this data set, it shows something interesting...
The average gains of about 4.3% far exceeded the average losses of roughly 2.3%. When stocks do well in October, they tend to gain nearly twice as much as they lose in a bad year.
This year, the S&P 500 is up about 1% so far in October. For now, it's turning out to be another good month for stocks.
Of course, it's still early in the month. And that doesn't mean it'll be smooth sailing for the rest of October.
The S&P 500 Index is at record highs. And this brings us to market valuations – how expensive the S&P 500 is today.
Take a look at the chart below...
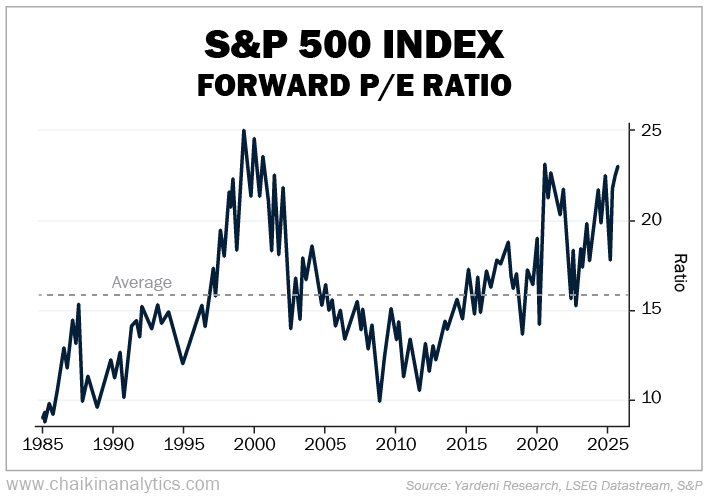
This shows the forward price-to-earnings (P/E) ratio of the S&P 500 dating back to 1985. And over that time frame, the average ratio is roughly 16 times.
Today, the market is trading at a forward P/E ratio of around 23 times. That's roughly 44% higher than its historical average.
However, this alone doesn't mean the market is due for a correction. As long as earnings are growing at a reasonable pace, the forward P/E ratio tends to fall.
This leads us to the market's price-to-earnings-growth ("PEG") ratio. It tells us how expensive stocks are relative to the rate of growth in earnings.
Normally, a PEG ratio of 1 or less is considered undervalued. It means that earnings are growing as fast or even faster than the P/E ratio. And it tells us whether a high P/E ratio is justified.
For example, a company trading at a forward P/E ratio of 30 times might be considered overvalued. But if its earnings are growing by 40%, it trades at a PEG ratio of 0.75 times.
Put simply, this means its earnings are growing so fast that a high P/E ratio today is justified. Investors are willing to pay a premium now in return for the growth the company expects in the future.
Earlier this month, the S&P 500 hit PEG ratio of about 1.35 times. That's an expensive level.
And take a look back at that chart above...
You'll notice that the market's forward P/E ratio today is close to the two highest peaks in recent history.
Yes, recent history tells us that October is actually a good month for stocks. But with the current context of high valuations, we could be due for a breather.
To be clear, I'm not saying to run for the hills right now...
After all, the Power Gauge still gives the SPDR S&P 500 Fund (SPY) a "bullish" rating today. And 121 stocks in the fund currently earn a "bullish" or better grade.
This means the current uptrend in the market still has legs.
Overall, my point is simple. In regard to an "October effect," don't be surprised to see some volatility in stocks in the weeks ahead.
Good investing,
Vic Lederman